
On this page
Abstract
Webhooks are simple to receive and hard to operate. Failures can be difficult to trace, retries can become manual, and the record of what a provider actually sent can be easy to lose. HookTrace is an open-source, self-hostable system for receiving, inspecting, delivering, retrying and replaying webhooks. This paper explains the problem, the webhook lifecycle, the product screens, and the operational model behind HookTrace.
§ 1
The problem: easy to receive, hard to operate
A webhook is a single HTTP request from someone else’s system. Receiving it takes a few lines of code. Operating it is harder, because you do not control the sender, the network, or the moment your own service happens to be down.
When something goes wrong, three questions come up. Did the event arrive at all? Did it reach the right place? If it failed, can it be delivered again without asking the sender to resend it? Without a system built for this, each answer means searching logs or writing one-off scripts.
HookTrace exists to make those three answers visible in one place.
§ 1.1
Why self-host?
Online webhook inspectors are useful when you need a temporary URL to see what a provider sends during development. HookTrace is aimed at a different layer of the problem: teams that want a persistent system for operating webhooks rather than only inspecting a single request.
Self-hosting lets a team run HookTrace inside its own environment and keep webhook ingestion, event history, delivery state and replay workflows under its control. The goal is not to replace every lightweight webhook testing tool, but to provide an open-source foundation for teams that want ownership of their webhook infrastructure.
Temporary inspection
Useful for quickly seeing a webhook during development or troubleshooting.
Production webhook operations
Persistent events, delivery attempts, retries, dead-letter handling and replay in infrastructure your team can operate itself.
§ 2
The lifecycle of a webhook
Every event moves through the same operational stages. Aggregation is optional. The core flow records what arrived, controls where it goes, records delivery attempts, and preserves failed events for recovery.
Sender
A provider such as Stripe makes an HTTP request.
Connection
Gives that provider its own webhook URL.
Route
Receives the request and records it as an event.
Aggregation
Optional. Batches or deduplicates events.
Destination
Delivers to your endpoint and records each attempt.
§ 3
Inside the product
The figures below are screenshots of the current app, captured with development data. Select any figure to enlarge it.
3.1The dashboard
The dashboard is the summary. It answers one question first: is anything wrong right now? Counts for incoming, delivered, failed, retrying and dead-lettered events sit above a chart of the last 24 hours.
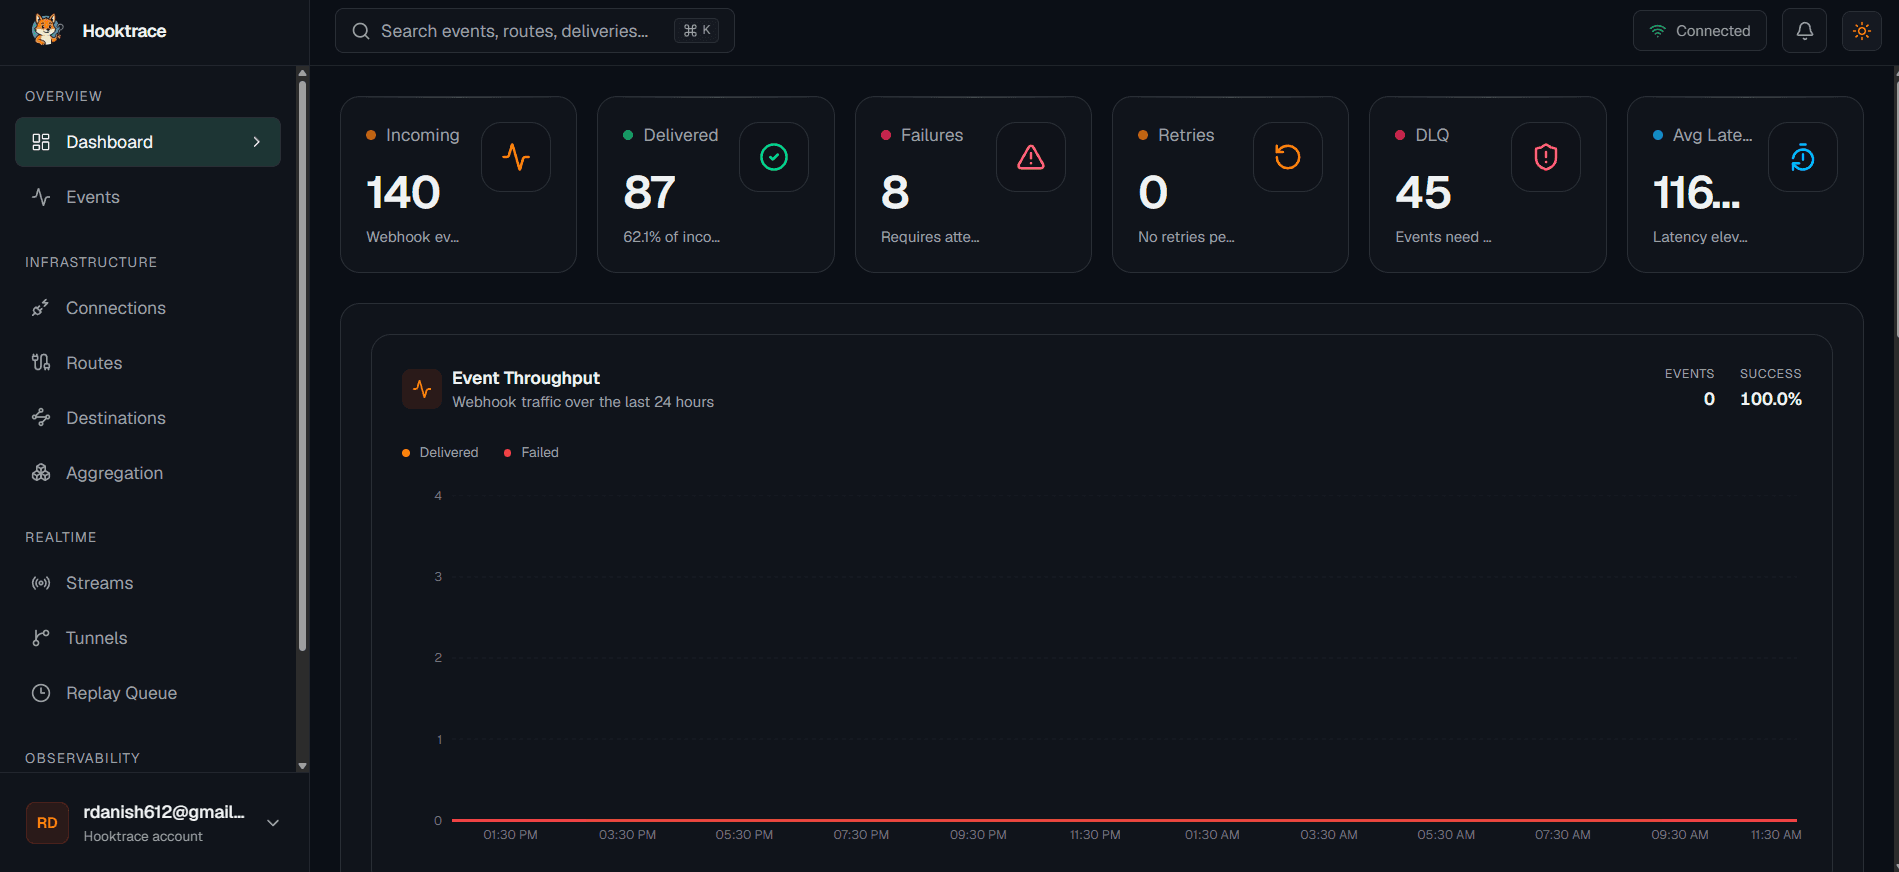
On this screen
- Incoming, Delivered, Failures, Retries, DLQ and average latency as separate counters
- Event throughput over 24 hours, split into delivered and failed
3.2Connect a provider
A connection is the entry point for one sender. You create it, copy the webhook URL HookTrace generates, and register that URL with the provider.
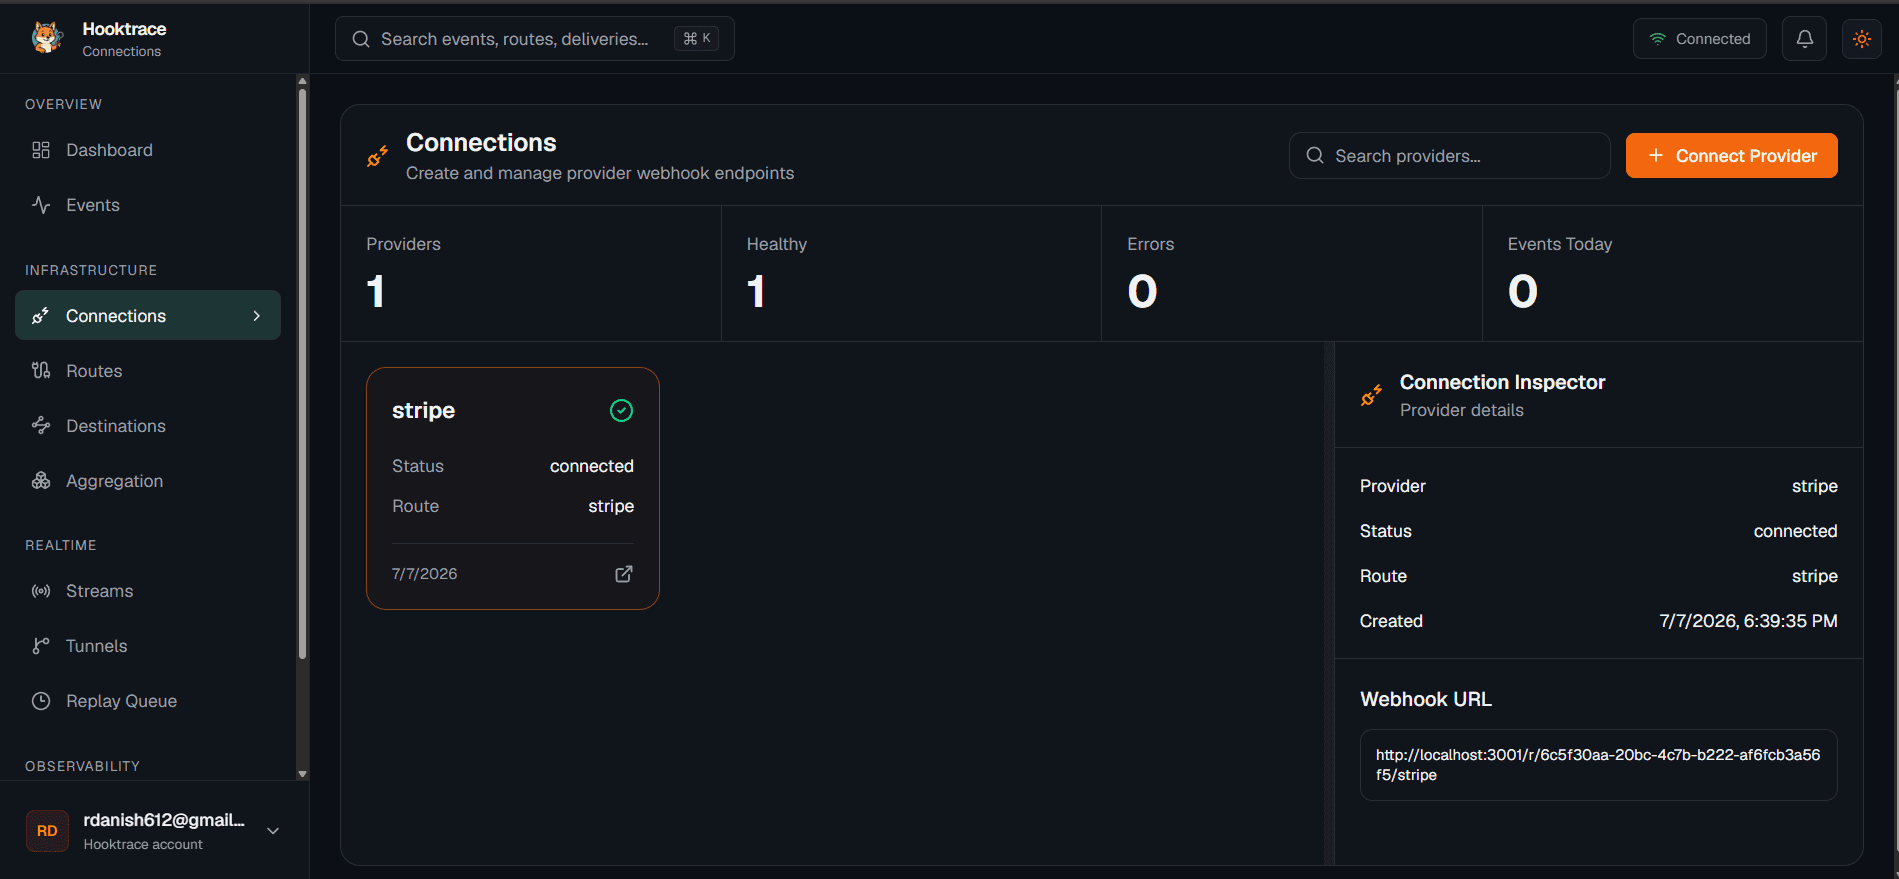
On this screen
- Each provider with its status and the route it maps to
- Totals for providers, healthy connections, errors and events today
- The webhook URL in the inspector
3.3Manage routes
Routes are the ingress paths. Every route has its own endpoint, an environment mode, and a set of targets, so what arrives where is never ambiguous.
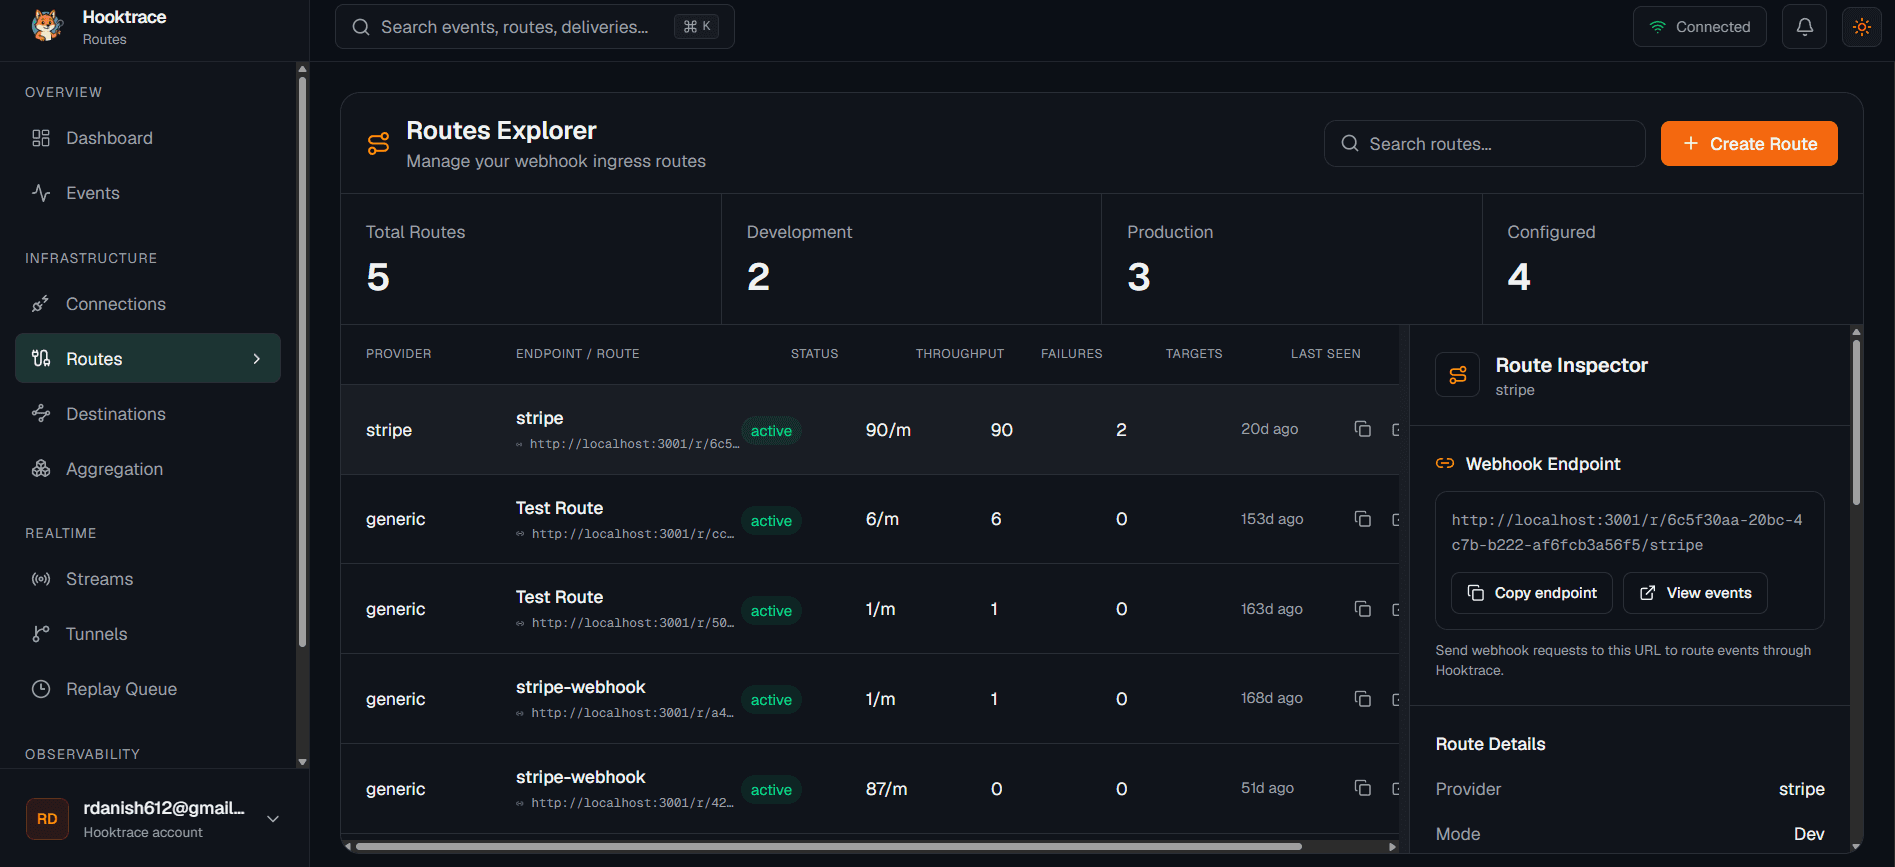
On this screen
- Status, throughput, failures, targets and last-seen time per route
- Development and production route counts
- Copy the endpoint, or jump to that route’s events
3.4Inspect every event
The event workspace is a live list of everything that arrived. Each row shows the outcome and how many delivery attempts it took, so a failure is visible without opening a log file.
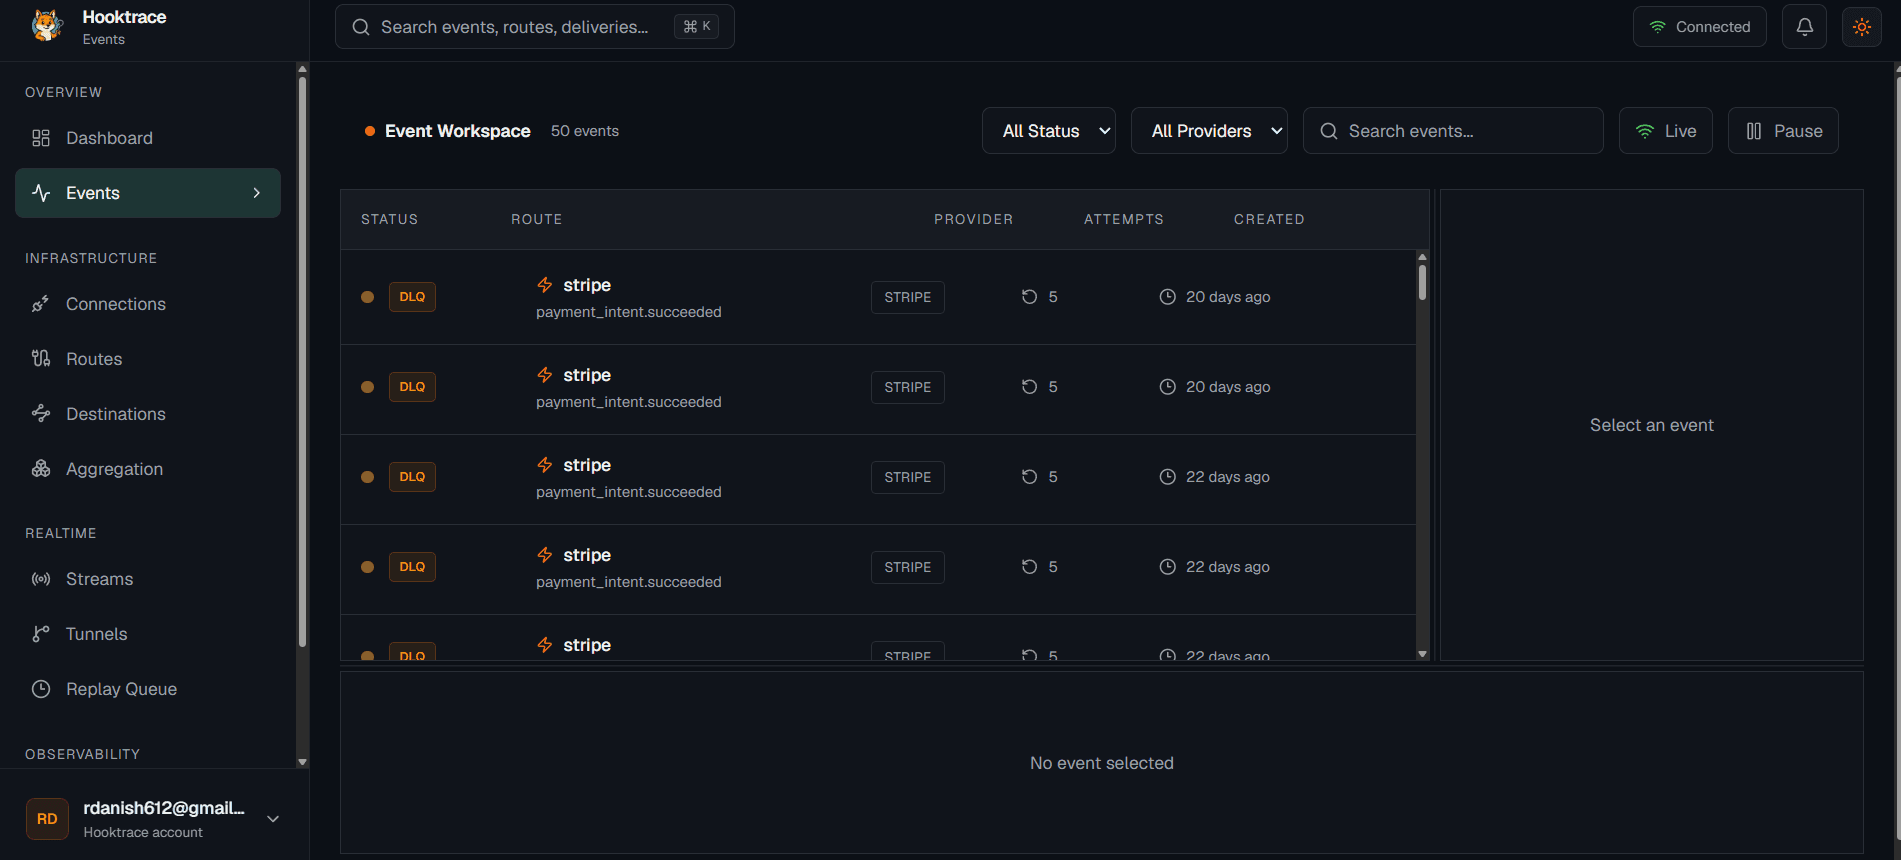
On this screen
- Filter by status and provider, or search
- Pause and resume the live stream
- Status, route, provider, attempts and age for every event
3.5Aggregate high-volume traffic
Some senders are noisy. Aggregation rules group events into batches and skip duplicates before delivery, and the page reports how much each rule saved.
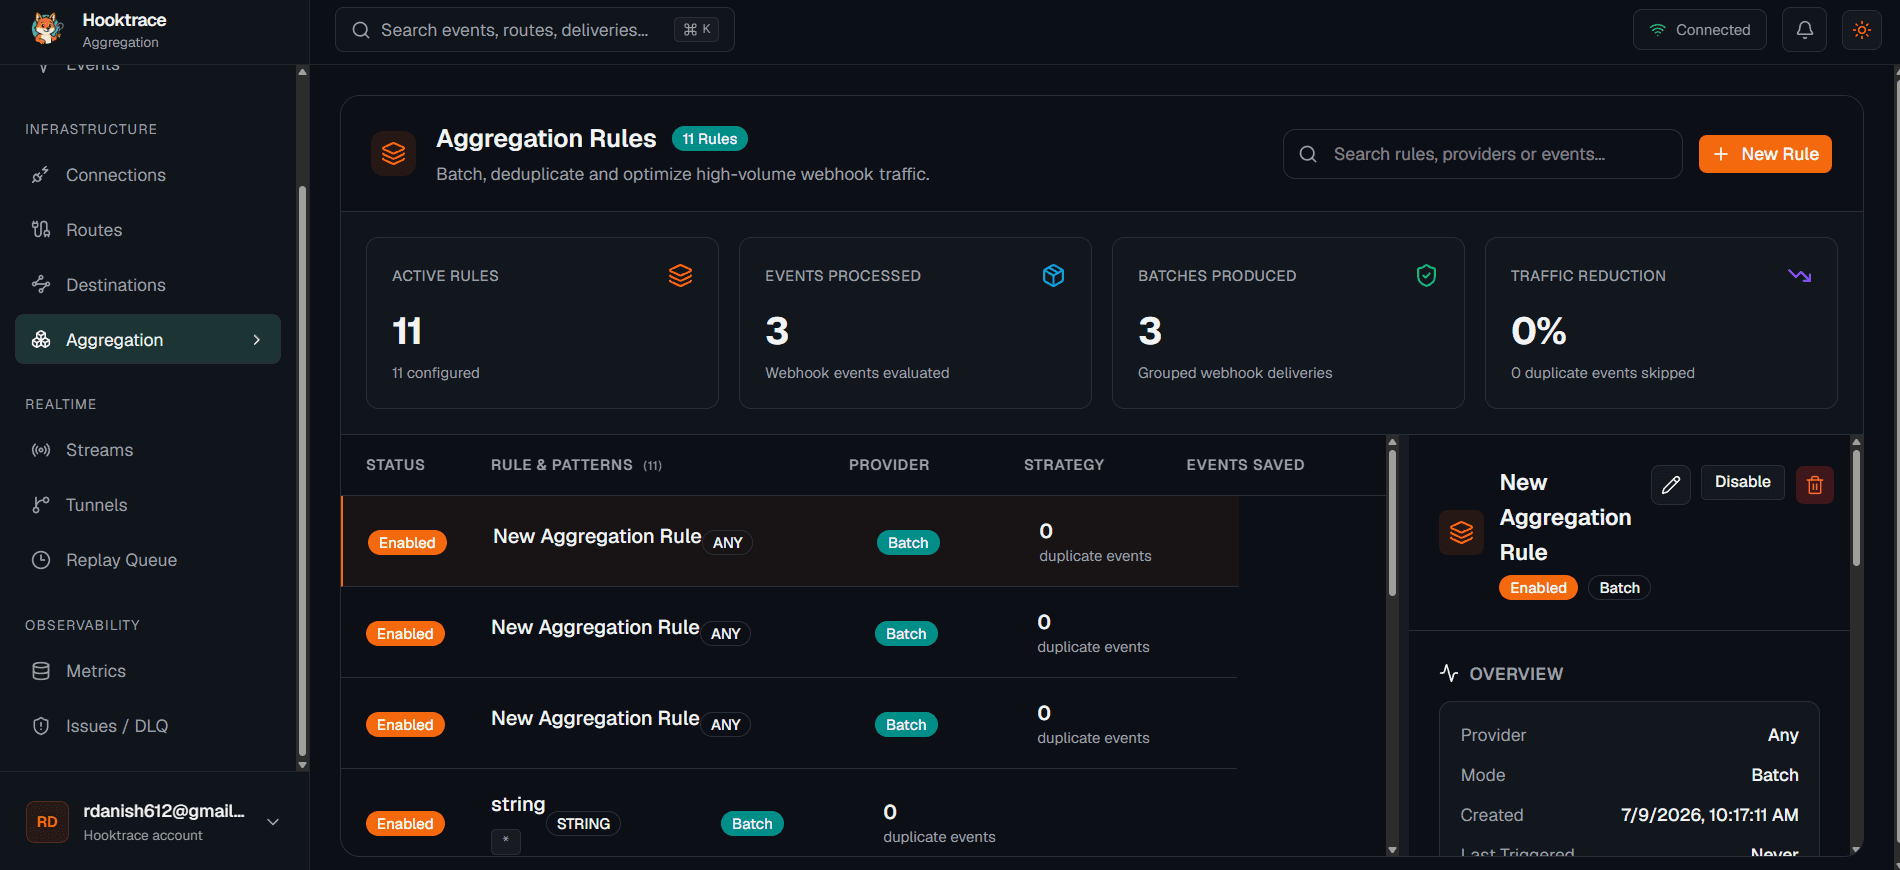
On this screen
- Active rules, events processed, batches produced and traffic reduction
- Per-rule provider, strategy and events saved
- Enable, disable, edit or delete a rule from the inspector
3.6Deliver to destinations
A destination is where events end up. Each one tracks its own health, delivered and failed counts, and latency, and can be tested before you depend on it.
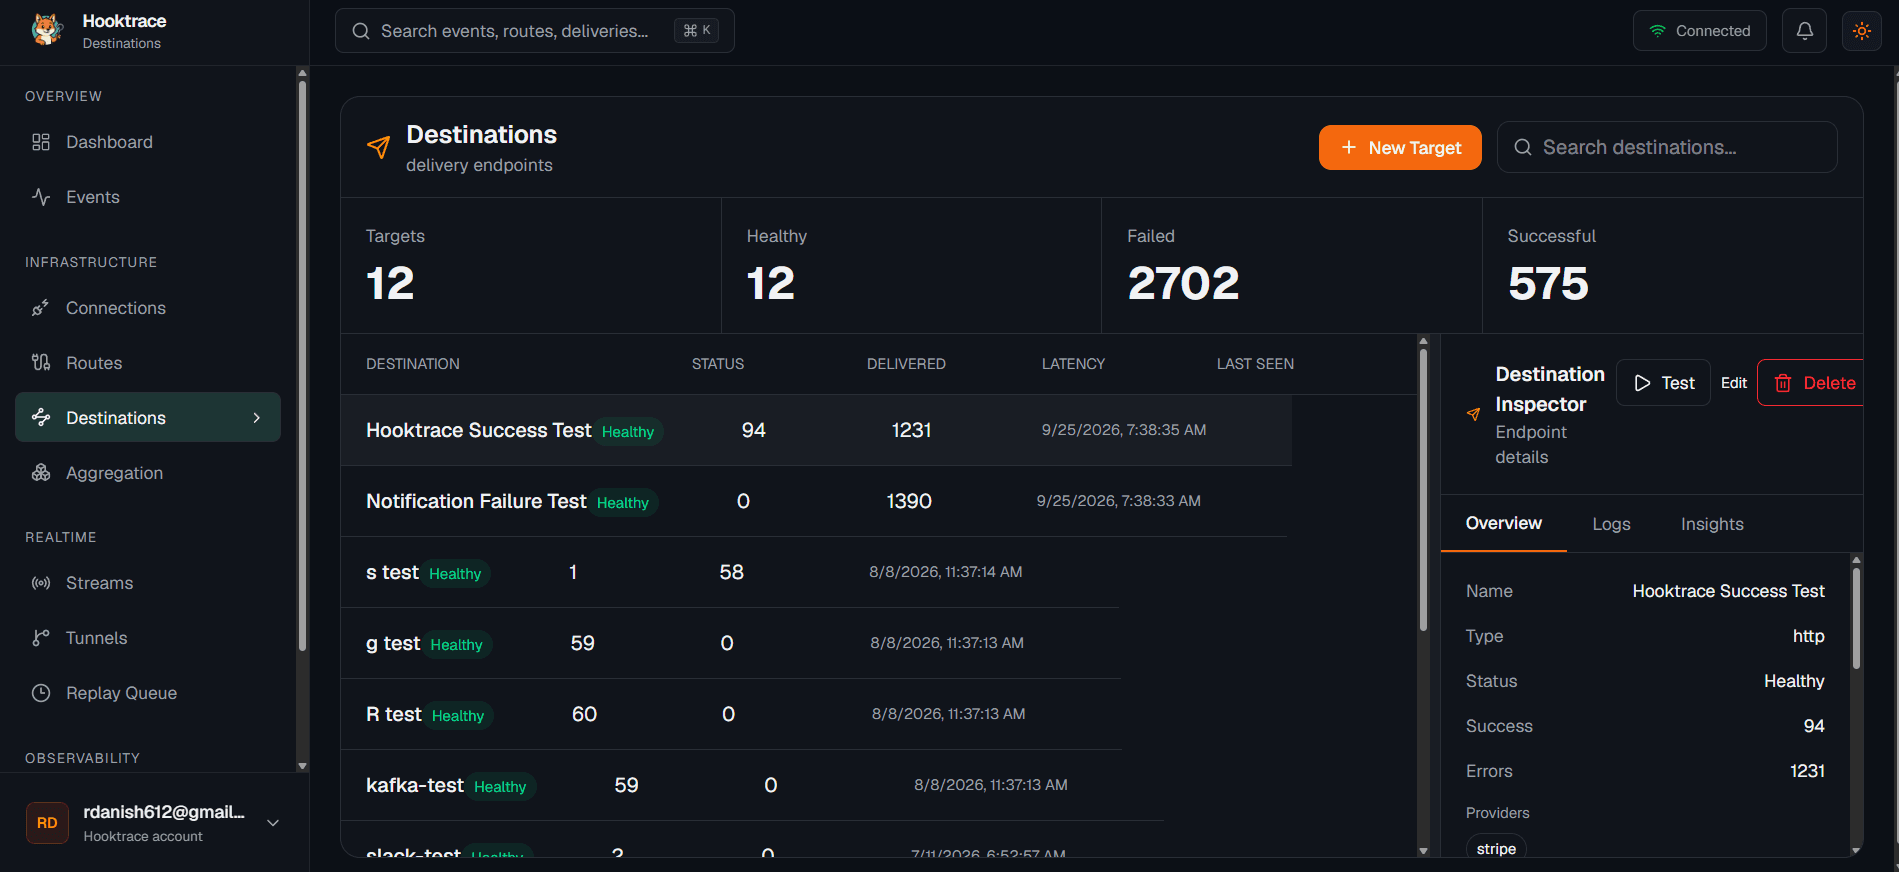
On this screen
- Targets, healthy, failed and successful totals
- Delivered count, latency and last-seen time per destination
- Test, edit or delete, with Overview, Logs and Insights tabs
3.7Replay what failed
Failed events are not discarded. They wait in the replay queue with their payload intact. You can inspect one, replay it, or replay every failed event in one action.
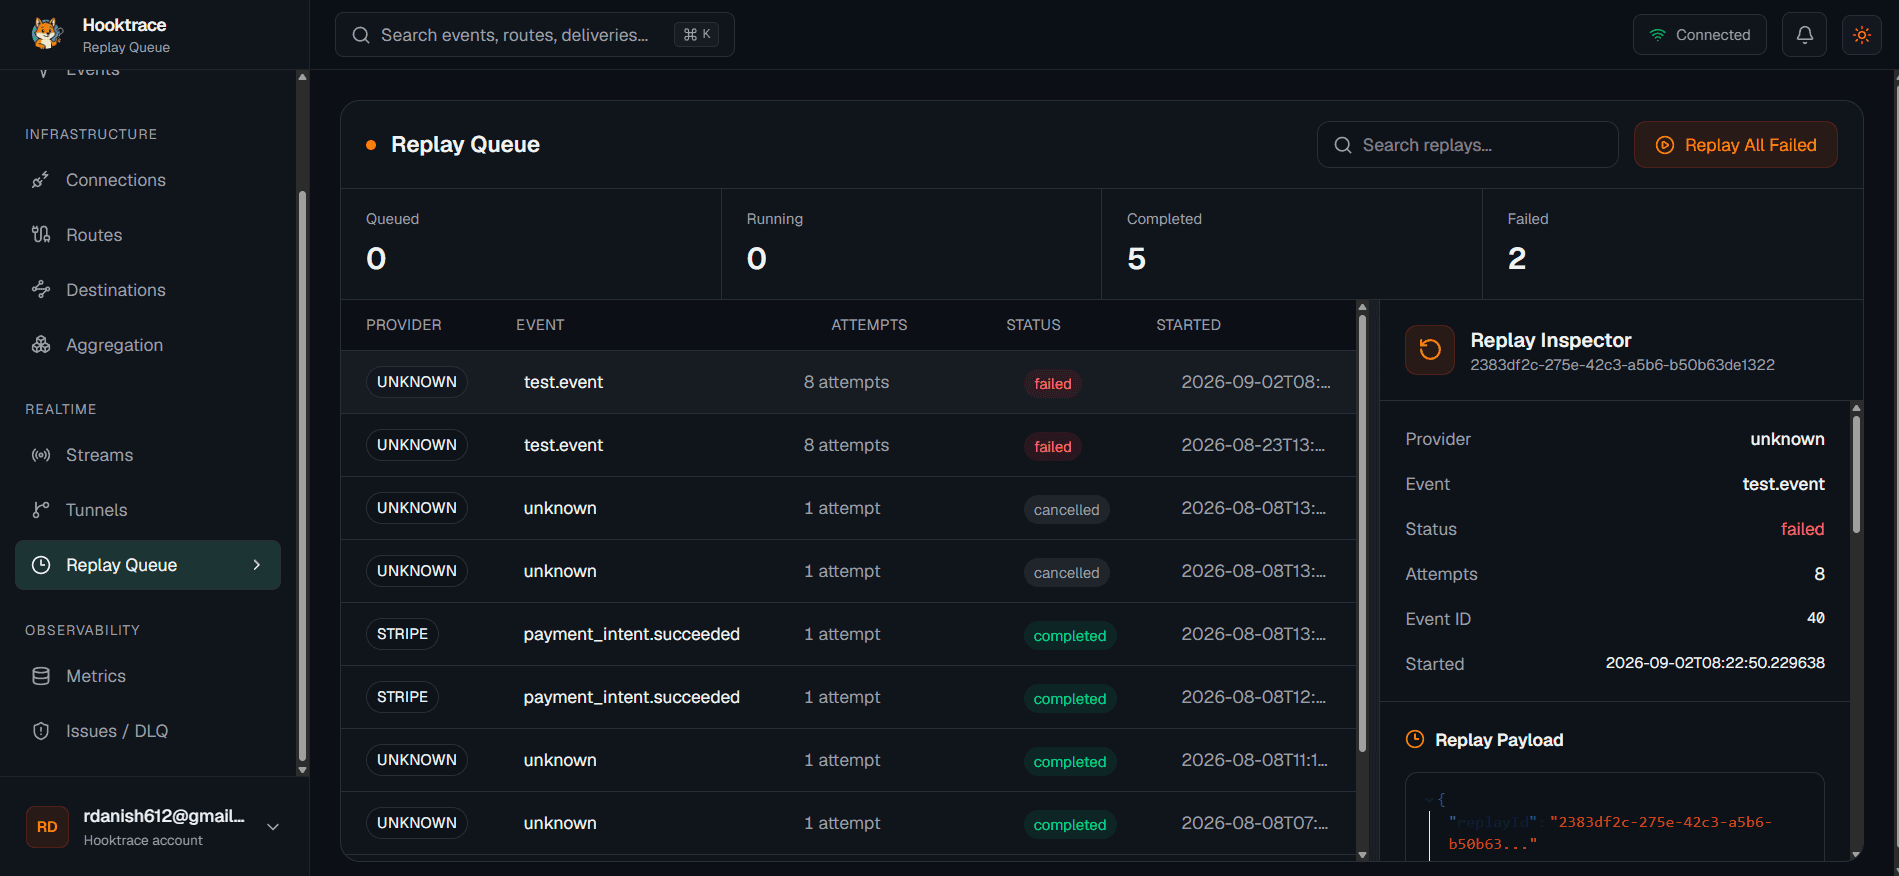
On this screen
- Queued, running, completed and failed counts
- Attempts and status for each replay
- The replay payload in the inspector, and Replay All Failed
3.8Develop against localhost
Dev tunnels give you a public URL that forwards incoming webhooks to a server on your machine. The sender never has to change.
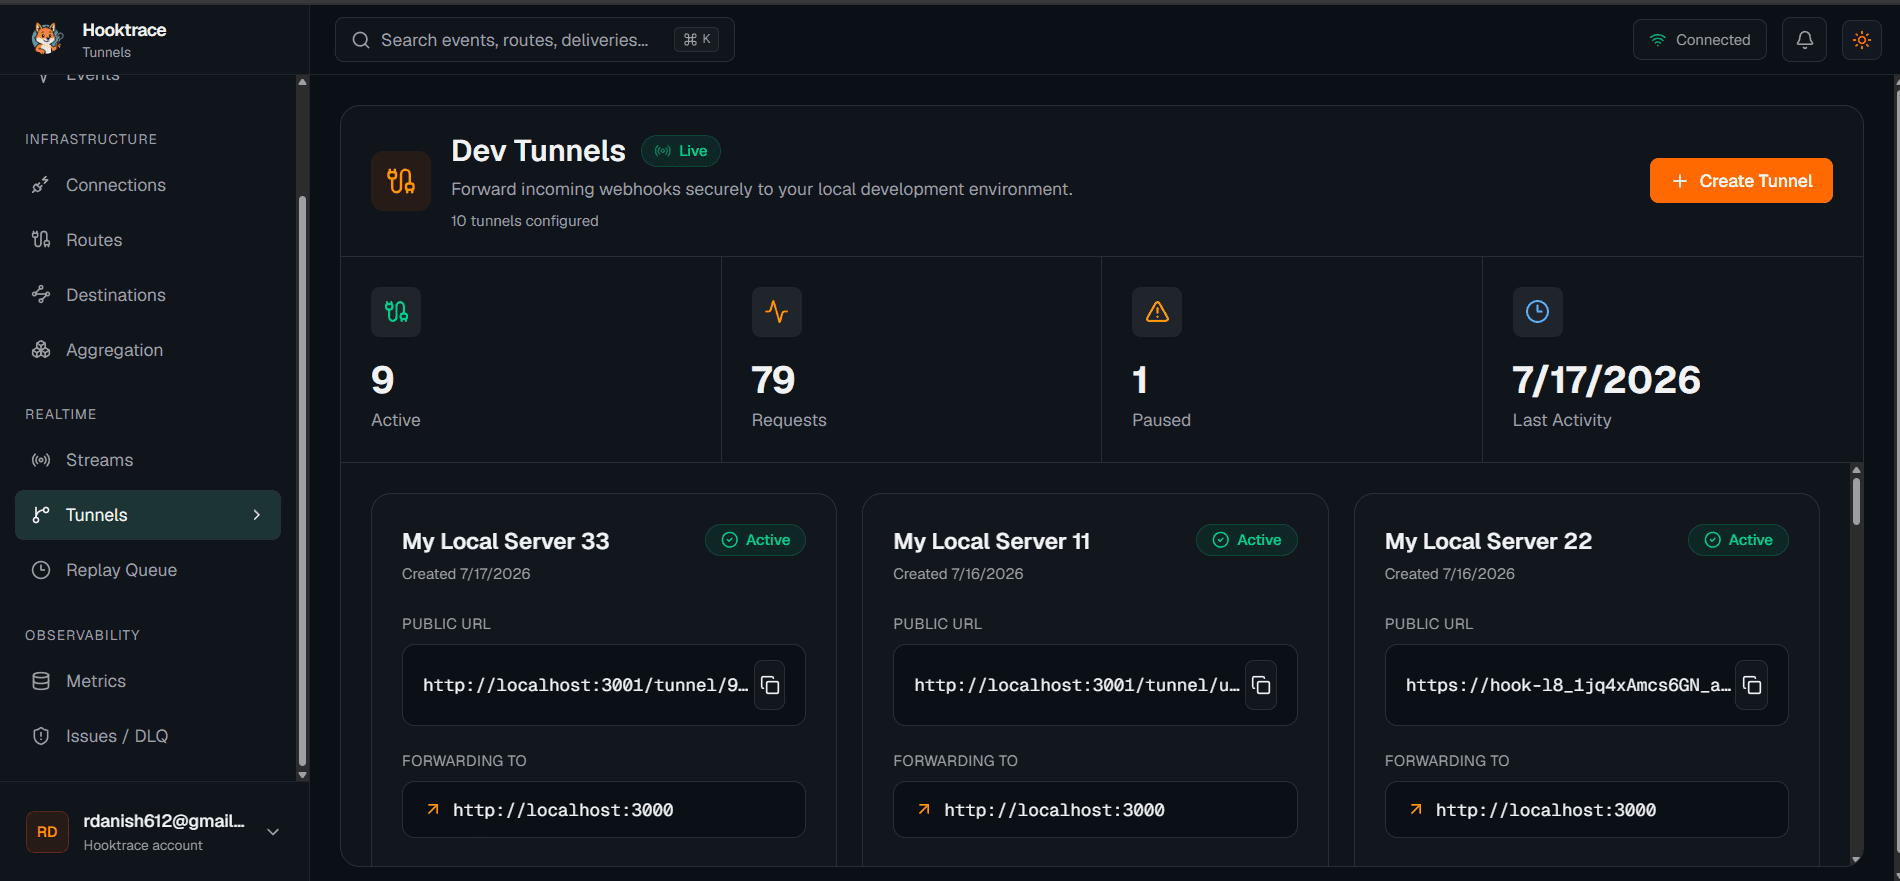
On this screen
- Each tunnel’s public URL and the local address it forwards to
- Active tunnels, request count, paused tunnels and last activity
§ 4
A failure, end to end
An illustrative production scenario: a payment webhook arrives while your own service is unavailable.
Stripe sends payment_intent.succeeded.
It reaches the stripe route and is recorded as an event.
Your endpoint is down.
The first delivery attempt fails.
HookTrace retries.
Each attempt is counted on the event.
The event lands in the DLQ.
Once its attempts are used up it is marked DLQ and stays visible in the event workspace.
You fix your endpoint.
Nothing was lost, so there is nothing to reconstruct.
You replay the event.
Check the payload in the replay queue, then replay it, or use Replay All Failed.
§ 5
Glossary
- Event
- One webhook request received by HookTrace.
- Connection
- The entry point for a single provider, with its own webhook URL.
- Route
- An ingress path that receives events and hands them to targets.
- Destination
- An endpoint HookTrace delivers events to.
- Attempt
- One try at delivering an event to a destination.
- Aggregation rule
- A rule that batches or deduplicates events before delivery.
- DLQ
- The dead-letter queue: events that still need attention after delivery attempts.
- Replay
- Sending a stored event through delivery again.
- Tunnel
- A public URL that forwards webhooks to a local server.
§ 6
Get started
HookTrace is open source and self-hostable. Run it in your own environment, inspect the code, and build your webhook workflow around infrastructure you control. HookTrace Cloud is planned for teams that prefer a managed service instead of operating the stack themselves.